
Figure 5. Quantifying Vessel Density in OCTA Images.
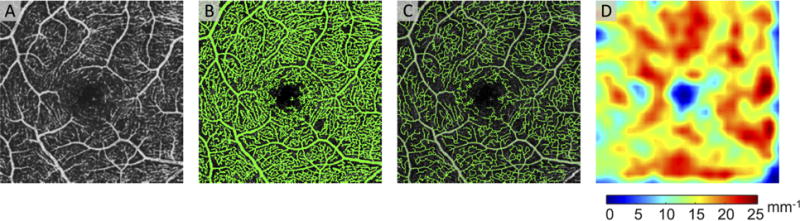
(A) An example of an en face 3×3 mm2 region centered on the healthy human fovea. (B) A thresholded image shows the binarized vasculature in green. (C) After skeletonization, the vessel centerlines are determined. The vessel centerlines are shown as green lines overlayed on top of the en face OCTA. (D) The vessel density is calculated from the vessel skeleton.