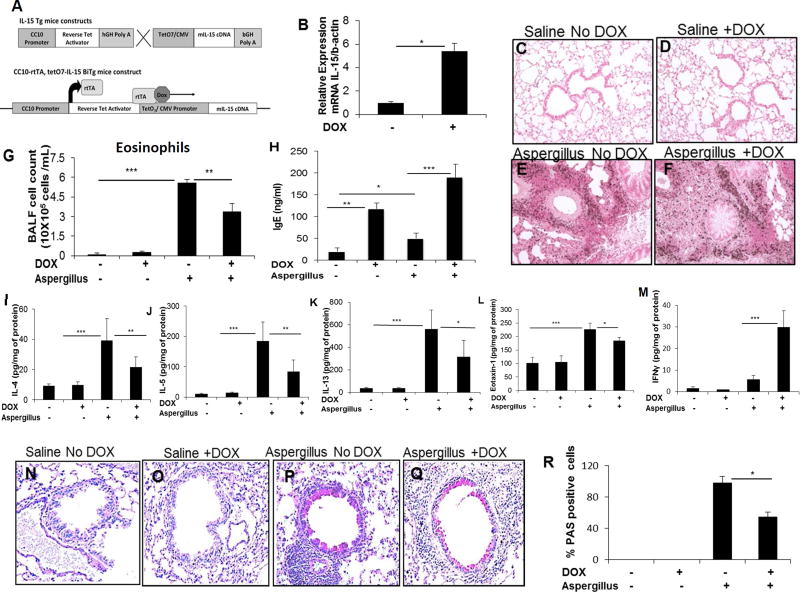
Figure 3. Generation of DOX regulated IL-15 transgenic mice and the analysis of eosinophils, proinflammatory cytokines, and goblet cell hyperplasia in Aspergillus exposed IL-15 transgenic mice.
The construct of (tetO)7 CMV-IL15 transgenic mice and rtTA-CC10 transgenic mice to generate rtTA-CC10-IL-15 bi-transgenic mice is shown (A). Induction of IL-15 mRNA levels following 3 weeks of DOX exposure to rtTA-CC10-IL-15 bi-transgenic mice is shown (B). A representative photomicrograph (original magnification x400) of anti-MBP-stained saline and Aspergillus challenged CC-10 IL-15 bitransgenic mice (C-F), BALF eosinophils (G), blood IgE (H), cytokine and chemokine levels of IL-4, IL-5, IL-13, IFN-γ, eotaxin-1 (I-M) in saline or Aspergillus challenged DOX non-DOX exposed mice are shown. A representative photomicrograph of goblet cell hyperplasia (N-Q) and respective cell numbers in saline and Aspergillus challenge DOX and non-DOX exposed IL-15 bitransgenic mice are shown (R). Data is expressed as mean ± SD, n=12. *p<0.04 **p<0.001, *** p<0.0001, NS, not significant. A high-resolution version of this slide for use with the Virtual Microscope is available as eSlide: VM03992 (3C, saline-anti-MBP); VM03970 (3E, Aspergillus, anti-MBP); VM03993 (3N, saline challenged PAS stained); VM03971 (3P, Aspergillus, PAS stained showing goblet cell hyperplasia).

