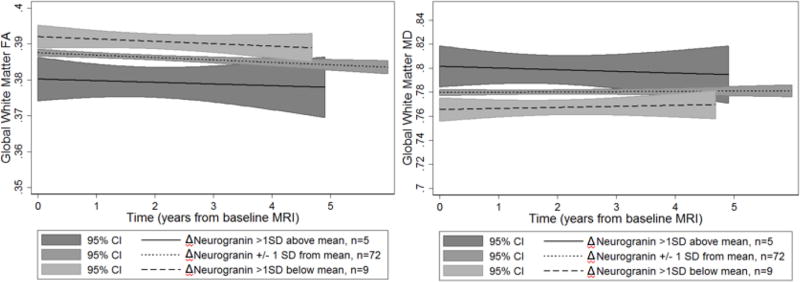
Figure 3. Predicted associations between ΔCSF biomarkers levels of neurogranin and longitudinally-measured white matter diffusion metrics in global white matter.
Larger increases in neurogranin (Δneurogranin) were associated with lower FA (left) and higher MD (right) overall, but not with change over time (slopes are not significantly different from zero). Although ΔCSF variables were analyzed as continuous predictors, for visualization purposes they are displayed as high (Δ values greater than 1 SD above the mean, solid line), mean (Δ values within 1 SD of the mean, dotted line), and low (Δ values >1 SD below the mean, dashed line). Y-axis: Fractional Anisotropy (FA, left) or Mean Diffusivity (MD, right) in the global white matter region of interest. X-axis: Time operationalized as interval from baseline MRI in years. 95% Confidence Intervals (C.I.’s) are displayed by the gray shaded regions.

