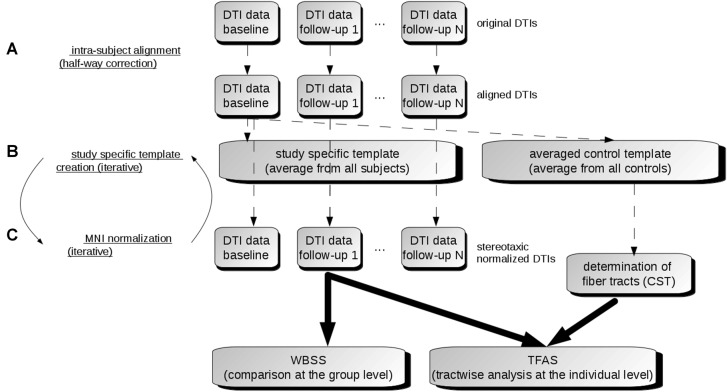
Figure 1.
Data analysis scheme. (A) In order to obtain a common coordinate frame, all diffusion tensor imaging (DTI) data (b0) were aligned to baseline data. From these b0, a subject-specific template was created for each subject separately. In the next step, b0 of baseline and follow-ups were aligned to the subject-specific template. (B) After creation of a study-specific template in the Montreal Neurological Institute (MNI) coordinate frame, DTI data of all visits were stereotaxically normalized (C). DTI metrics maps were calculated from normalized DTI data. Then, the voxelwise statistical comparison between the patients and the control group was performed. After averaging controls’ data sets, fiber tracts were calculated from this averaged data set. Finally, tractwise fractional anisotropy statistics (TFAS) was applied.

