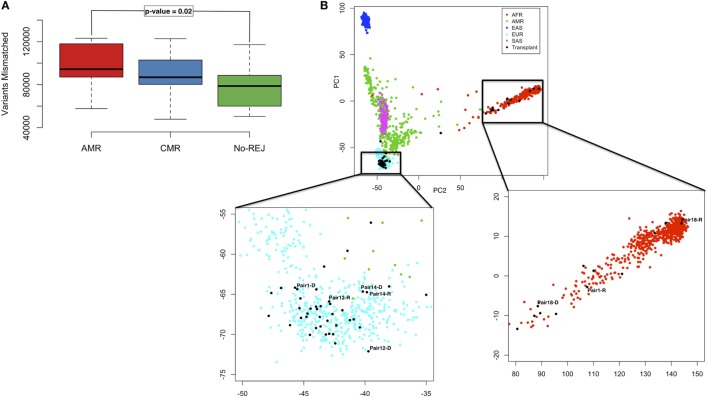
Figure 3.
Boxplot representing the distribution of mismatched variants in each D/R pair, stratified by the clinical endpoints of antibody-mediated rejection (AMR), T-cell-mediated rejection (CMR), and no-rejection (NoRej) (A). Principal component analysis plot with the 1,000 G as reference panel (AFR, African population; AMR, American population; EAS, East Asian population; EUR, European population; and SAS, South Asian population). The black dots represent the 28 pairs from our data. Pair 1 shows an example of race mismatch, Pair 14 an example of pair related, and Pairs 12 and 18 an example of a white pair and a black pair, respectively (B).

