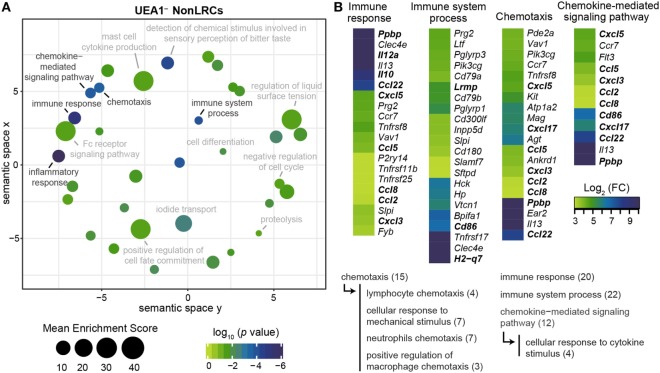
Figure 5.
UEA1– NonLRCs are well adapted to communicate with hematopoietic cells. (A) REViGO graphical representation of significant gene ontology (GO)-term enrichment for genes expressed at higher level in UEA1– NonLRCs than UEA1– label-retaining cells (LRCs). The position of GO-terms represents their semantic similarities calculated by REViGO, the size represents the mean enrichment score of the GO-terms contained in each point, and the color indicates the p value for that particular GO-term. (B) Heatmap showing the differential expression of genes involved in GO-terms related to interactions with hematopoietic cells. All GO-terms are determined using DAVID online bioinformatic gene enrichment tool from the top 500 genes expressed at higher level in UEA1– NonLRCs than UEA1– LRCs. Semantic relations between GO-terms of interest are shown below, and the number of genes per GO-term is shown in parentheses.

