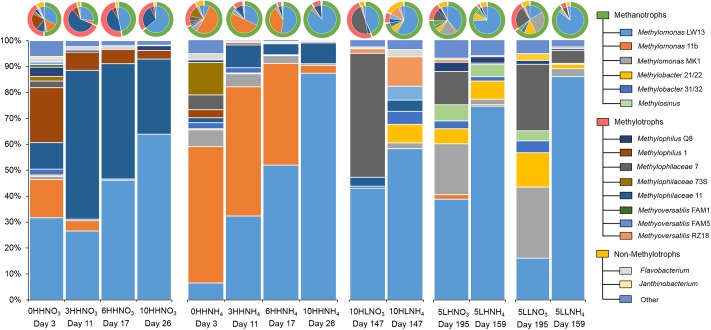
FIGURE 2.
Strain-resolved transcript abundances for major expressing species, as fractions of total transcripts. For Methylosinus, transcripts for all four strains were combined. On top, pie charts represent the same data, along with broad-function guild abundances (outside circles). Sample designations (at the bottom) refer to number of transfers, followed by methane and O2 regimens (H or L), followed by the nitrogen source. The day of sampling from the beginning of the experiment is also indicated for each sample. For more information, see Supplementary Table S1.

