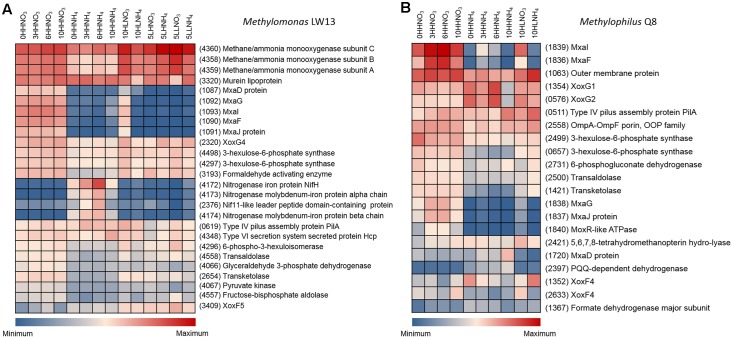
FIGURE 3.
Heatmaps of some of the most highly/most differentially transcribed genes in (A) Methylomonas sp. LW13 and (B) Methylophilus methylotrophus Q8. Sample designations are as in Figure 2. In parentheses, protein numbers are shown as per genome annotation. See Table 1 for reference. See Supplementary Figures S1–S4 for highly transcribed genes in other major species.

