Figure 4.
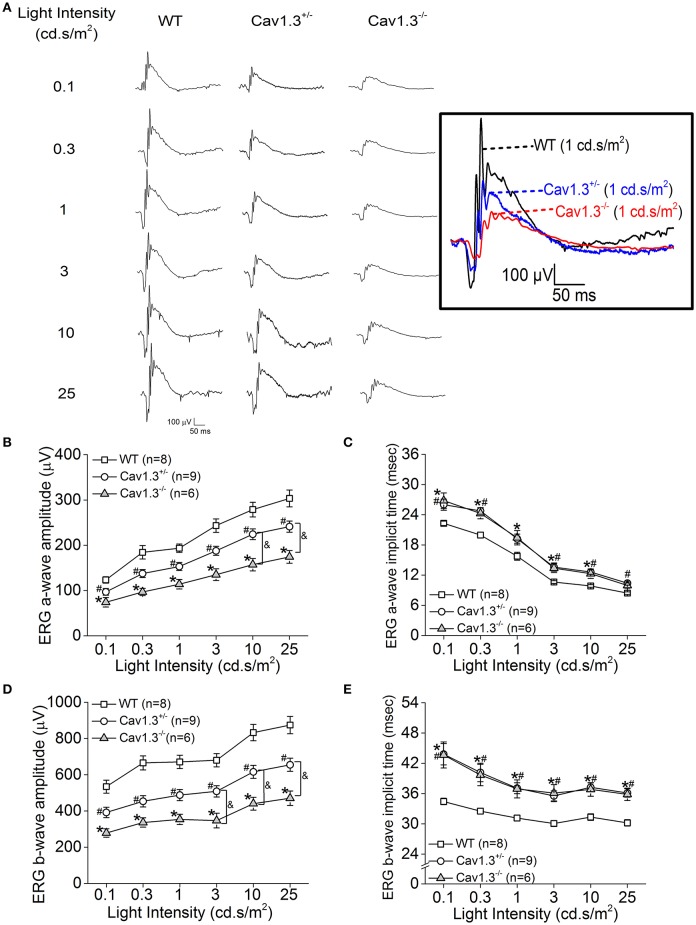
Retinal light responses are decreased in Cav1.3+/− and Cav1.3−/− mutant mice. The scotopic ERG amplitudes are decreased and implicit times delayed in both Cav1.3+/− (heterozygous mutant) and Cav1.3−/− (homozygous mutant) mice compared to the wild type (WT) mice. All mice were dark adapted for at least 8 h. Retinal light responses were measured when mice were exposed to a series of light intensities from 0.1 to 25 cd·s/m2. (A) Representative ERG wave forms recorded from WT (left), Cav1.3+/− (middle), and Cav1.3−/− (right) mouse eyes in response to each stimulating light intensity. The superimposed ERG traces from the WT (black), Cav1.3+/− (blue), and Cav1.3−/− (red) mice elicited at 1 cd.s/m2 light intensity are shown in the box. (B) The average ERG a-wave amplitudes are decreased in Cav1.3+/− and Cav1.3−/− mice compared to the WT. (C) The average ERG a-wave implicit times are increased in Cav1.3+/− and Cav1.3−/− mice compared to the WT. (D) The average ERG b-wave amplitudes are decreased in Cav1.3+/− and Cav1.3−/− mice compared to the WT. (E) The average ERG b-wave implicit times are increased in Cav1.3+/− and Cav1.3−/− mice compared to the WT. The asterisk (*) indicates a statistically significant difference between the WT and Cav1.3−/− mice; “#” indicates a statistically significant difference between the WT and Cav1.3+/− mice; “&” indicates a statistically significant difference between the Cav1.3+/− and Cav1.3−/− mice. *, #, &p < 0.05.

