Figure 6.
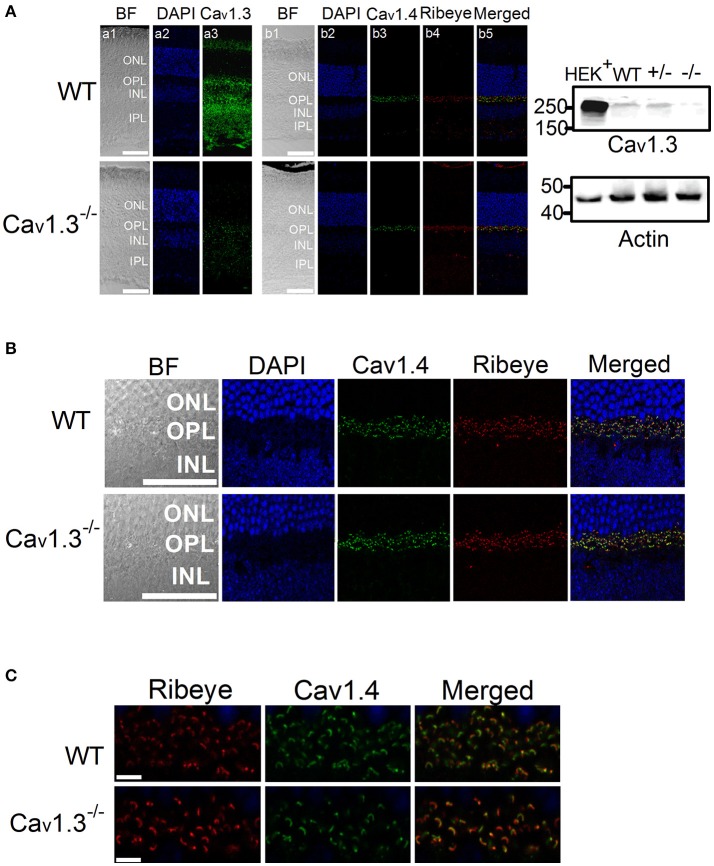
Immunofluorescent changes of Cav1.3, Cav1.4, and Ribeye in Cav1.3−/− mouse retinas. Cav1.3+/+ (WT) and Cav1.3−/− retinal sections (10 μm) were stained for Cav1.3, Cav1.4, and Ribeye. (A) Representative images at a lower magnification (20 X) of WT (upper panel) and Cav1.3−/− (lower panel) retinal sections. DAPI stains the cell nucleus. BF: bright field; ONL: outer nuclear layer; OPL: outer plexiform layer; INL: inner nuclear layer; IPL: inner plexiform layer. The scale bar = 50 μm. Right panel: The Western blots from Cav1.3 transfected HEK cells (HEK+), Cav1.3+/+ (WT) retina, Cav1.3+/− retina, and Cav1.3−/− retina show the protein band of Cav1.3 at ~250 kD. Actin serves as the loading controls. (B) Representative images at a higher magnification (40 X) of WT and Cav1.3−/− retinal sections stained for Cav1.4 and Ribeye. The scale bar = 50 μm. (C) Fluorescent images focused on the OPL at a higher magnification (80 X) from WT and Cav1.3−/− retinal sections are shown. The scale bar = 5 μm. The images taken at this magnification were used for statistical analyses (Table 3).

