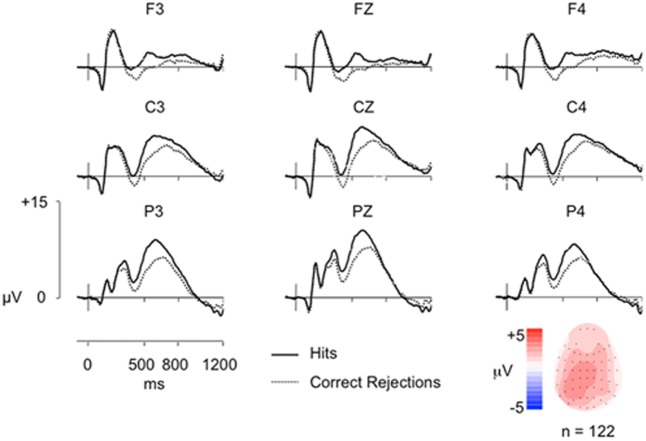
FIGURE 1.
Grand-average ERP old/new effects from a simple word recognition task (n = 122) at representative Frontal (F), Central (C), and Parietal (P) electrodes, along with a topographic map illustrating the old/new effect distribution from 500 to 800 ms. The vertical scale indicates electrode amplitude (microvolts) and the horizontal scale indicates change in time (milliseconds). The color scale indicates Hit-CR difference size (microvolts). Hit ERPs are more positive going than CRs from ∼300 ms post-stimulus onset (0 ms), reconverging by epoch end, with a maximal difference over left parietal electrodes (P3).

