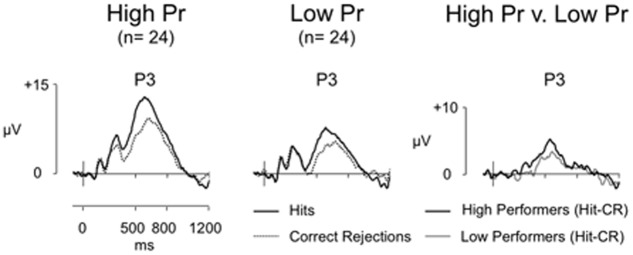
FIGURE 3.
Grand-average ERP old/new effects for high (n = 24) and low (n = 24) performance groups, and difference (Hit-CR) waveforms for each group at electrode P3 (scales as per Figure 1). For both groups Hit ERPs are more positive going than CRs, however, the difference in old/new effect magnitude at electrode P3 between high and low performers is minimal.

