
FIGURE 2.
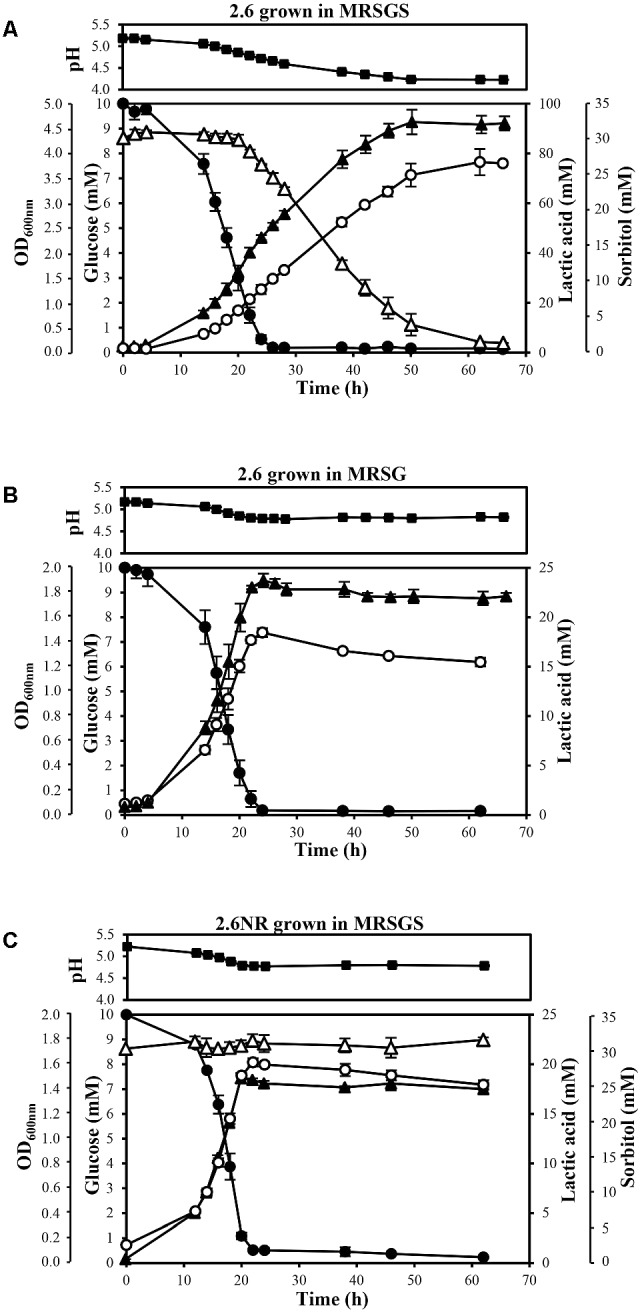
Analysis of metabolism of P. parvulus 2.6 (A,B) and 2.6NR (C) strains. Bacteria were grown in the indicated media. Symbols: OD600
nm ( ), glucose (
 ), sorbitol (
 ), lactic acid (
 ) and pH (
 ). The experiments were performed in triplicate and the mean value and standard deviation is depicted.