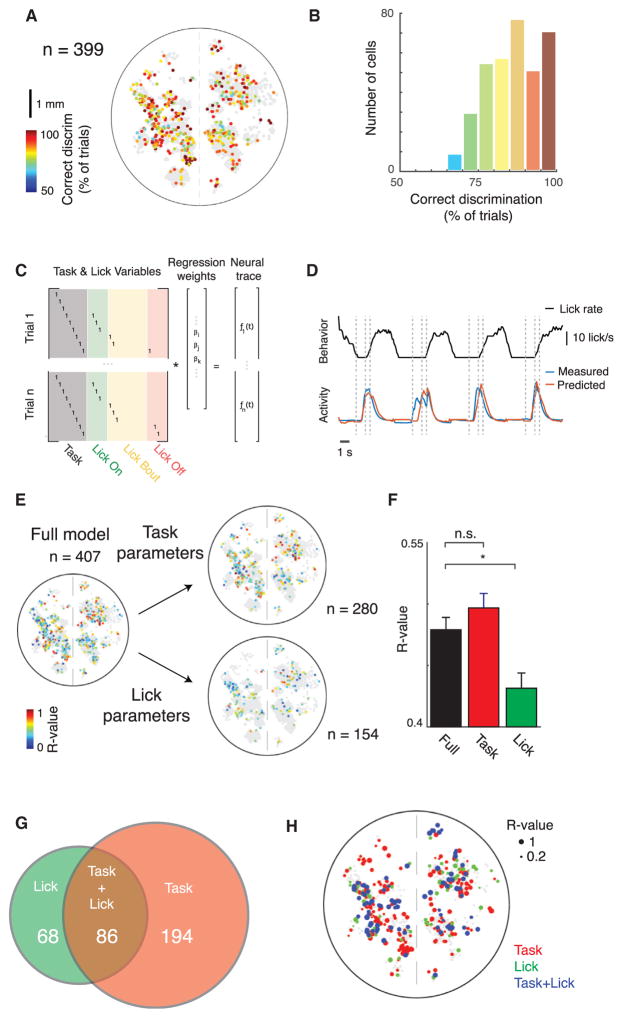
Figure 2. Widespread Single-Trial Encoding of Behavioral Choice throughout Neocortex.
(A) Decoding of trial type on a trial-by-trial basis: spatial distribution of single cells (n = 399) colored according to the percentage correctly distinguished single trials, as determined using ROC analysis. Non-gray cells can distinguish trial types significantly better than chance (p < 0.05, permutation test with chance level determined by shuf-fling trial labels).
(B) Histogram of data in (A).
(C) Structure of a generalized linear model (GLM) for separating task- and lick-related elements of neural activity. Task variables are consistent across multiple trials, whereas lick variables vary on a trial-by-trial basis.
(D) Example behavior trace (licking) and measured and GLM-predicted neural activity traces for example cell, on held out test data of four trials. Dashed lines indicated task events.
(E) Correlation of predicted and measured activity for single cells across cortex on held out test data, predicted using either the full model or just lick or task parameters in the model. n = 407 cells were significantly predicted with the full model, n = 280 with the task parameters, and n = 154 with the lick parameters. Only cells with statistically significant predictions are shown on a background of gray non-statistically significant cells (p < 0.05, permutation test).
(F) Average correlation coefficients for predictions using either the full model parameters, or just the licking- or task-related parameters. Same cells as in (E). *p < 0.05, Wilcoxon rank-sum test. Mean ± SEM.
(G) Venn diagram of task- and lick-correlated cells in (E).
(H) Locations of cells throughout cortex colored by whether they are significantly predictive using the task, licking, or both task and licking parameters, with the size of each dot scaled according to the correlation between predicted and measured fluorescence using the full parameter set.

