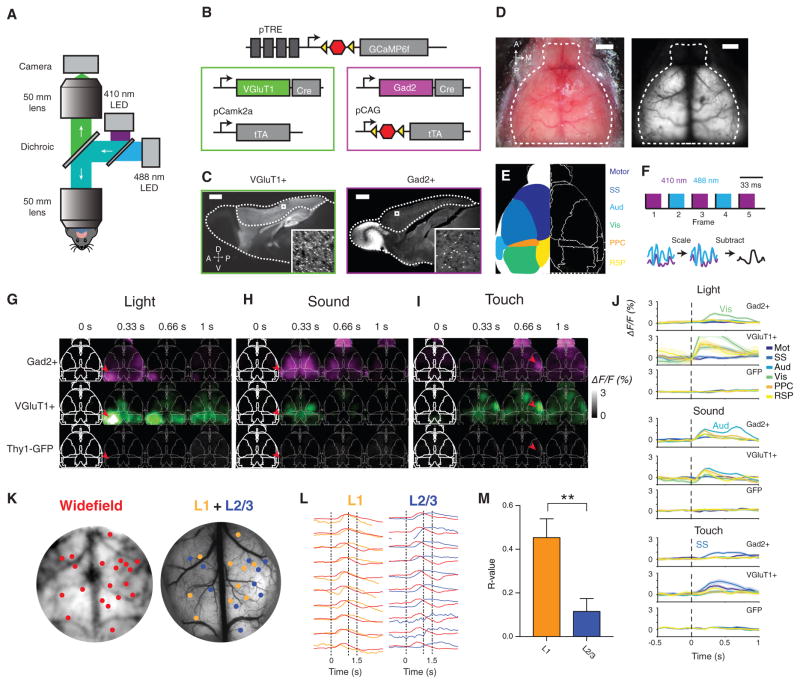
Figure 3. Cell-Type-Specific Synchronous Cortex-wide Imaging of Neural Activity.
(A) Macroscope schematic for whole-cortex wide-field imaging.
(B) Diagram of genetic strategy for expression of GCaMP6f in all inhibitory or excitatory neurons.
(C) GCaMP6f expression in VGluT1+ and Gad2+ brains, with cortex outlined. Inset: individual VGluT1+ and Gad2+ neurons expressing GCaMP6f.
(D) Left: bright-field image of mouse skull with clear cap. Right: transcranial fluorescence of excitatory neurons.
(E) Diagram of cortical regions overlaid on atlas.
(F) Blood-volume autofluorescence subtraction process. Top: schematic of alternating illumination sequence. Bottom: schematic of per-pixel blood fluorescence normalization scheme.
(G–I) Normalized fluorescence response of VGluT1+, Gad2+, and control mice to sensory stimuli, averaged across more than ten trials for a single mouse. Time points indicate end of integration window. (G) Flashing LED delivered to right eye for 0.5 s. Arrowhead indicates primary visual cortex. (H) Fifteen kilohertz auditory tone stimulation, delivered for 0.5 s. Arrowhead indicates primary auditory cortex. (I) Vibrating touch stimulus delivered to left whiskers for 0.5 s. Arrowhead indicates primary somatosensory cortex.
(J) Regional time series corresponding to (G), (H), and (I) in a VGluT1+, Gad2+, and GFP mouse, averaged across 30 stimulus presentations. For each stimulus, the indicated corresponding primary sensory region has the largest response. Error bars, SEM.
(K) Co-registration of average wide-field fluorescence and wide-field two-photon calibration image, allowing for the direct comparison of wide-field and two-photon signals from the same location in cortex. Orange dots indicate fields of view acquired at layer 1 (0–150 μm below the surface), and blue dots indicate fields of view acquired at layer 2/3 (150–350 μm below the surface).
(L) Overlaid average, maximum-normalized traces from several representative regions acquired via wide-field (red) and the summed full-frame fluorescence from two-photon microscopy (neuropil + soma) in L1 and L2/3. Dashed lines indicate task events.
(M) Average correlation between L1 and wide-field and between L2/3 and wide-field signals at equivalent locations. n = 21 L1 fields of view (FOVs), n = 62 L2/3 FOVs, from n = 3 mice. **p < 0.01, Wilcoxon rank-sum test. Error bars, SEM.

