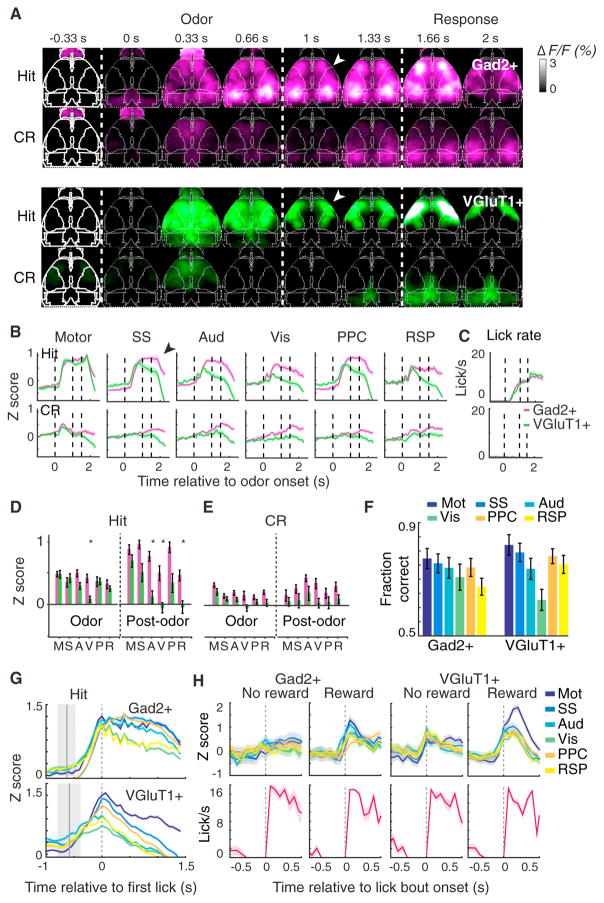
Figure 4. Inhibitory and Excitatory Neural Dynamics Reflect Task Engagement.
(A) Example video sequence of average fluorescence across hit and correct reject (CR) trials in a Gad2+ and VGluT1+ mouse. White arrowheads indicate fronto-parietal bias of VGluT1+ activity relative to the widespread Gad2+ activation following odor cue period.
(B) Average traces from six cortical regions on hit and correct reject (CR), averaged across mice for 9 Gad2+ and 12 VGluT1+ mice. (Means of 62 hit and 53 CR trials per mouse for VGluT1+ and 57 hit and 51 CR trials for Gad2+.) Error bars denote SEM. Black arrowhead indicates divergence between Gad2+ and VGluT1+ activity following the cue period in all regions except for motor cortex.
(C) Average lick rate on hit and CR trials averaged across mice for 9 Gad2+ and 12 VGluT1+ mice. Error bars denote SEM.
(D) Average values from (B) during 1 s odor delivery period or 0.5 s post-odor period during Hit trial, across n = 9 Gad2+ and 12 VGluT1+ mice. *p < 0.05, Wilcoxon rank-sum test, Bonferroni corrected.
(E) Same as (D), but for CR trial.
(F) ROC analysis of single-trial hit versus CR trial-type decoding across different cortical areas in Gad2+ and VGluT1+ mice.
(G) Timing of neural activity relative to behavioral onset in hit trials. The same data as in (B), aligned to the time of first lick and with different brain areas overlaid on the same scale. Gray region represents distribution of cue onset time relative to first lick.
(H) Un-cued task in which mice were rewarded only during a specific time window, while engaging in spontaneous bouts of licking. Top: overlaid traces of all seven cortical regions, aligned to beginning of lick bout, n = 2 Gad2+ and 3 VGluT1+, with 32, 49, 19, and 29 pooled trials from left to right. Bottom: corresponding aligned lick rate.
All values in (F–H) and (J) are mean ± SEM across mice and across pooled trials in (J). A, Aud, auditory; M, motor; p, PPC, posterior parietal; R, RSP, retrosplenial; S, SS, somatosensory; V, Vis, visual.

