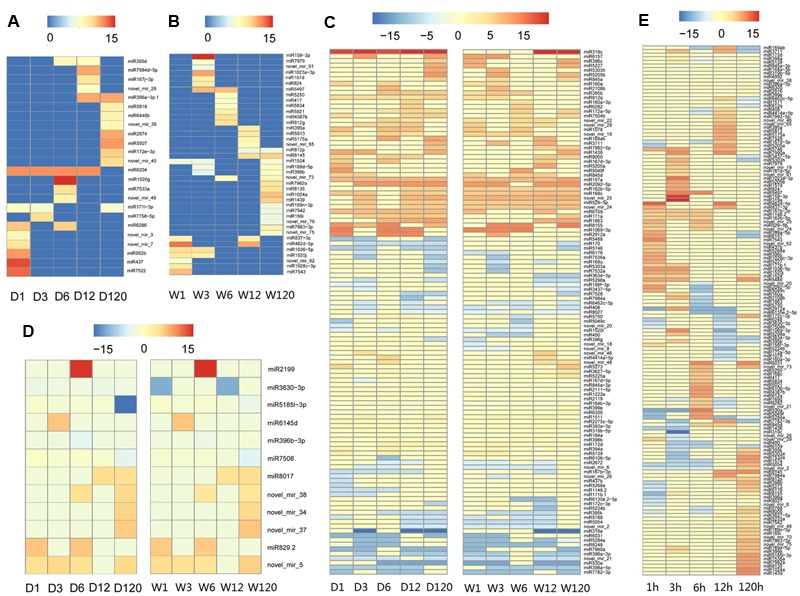
FIGURE 2.

Temporal patterns of microRNA expression in A. philoxeroides in contrasting hydrological habitats. (A) microRNAs specifically expressed in the upland-treated samples; (B) microRNAs specifically expressed in the pond-treated samples; (C) microRNAs expressed in both pond- and upland-treated samples but showing distinct expression dynamics; (D) microRNAs showing consistent expression patterns between the upland- and pond-treated samples; (E) microRNAs differentially expressed between the upland- and pond-treated samples. The color bars show log2 fold change value between the upland-/pond-treated samples and G0 sample (A–D) or between contrast pond- and upland-treated samples (E). The data is presented in Supplementary Tables S5, S6.
