
FIGURE 3.
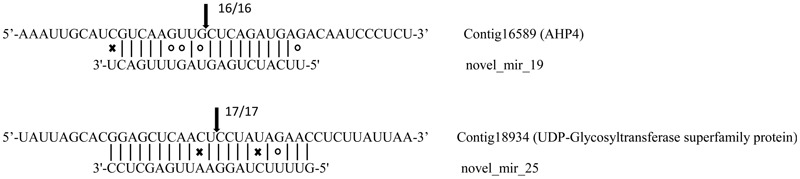
Targets of microRNAs verified by 5′ RLM-RACE. Arrows indicate the cleavage sites with the frequency of clones shown beside. Vertical dash lines represent the Watson-Crick pairing. Circles and crosses indicate the G:U wobble pairing and mismatched base pairing, respectively.