
FIGURE 4.
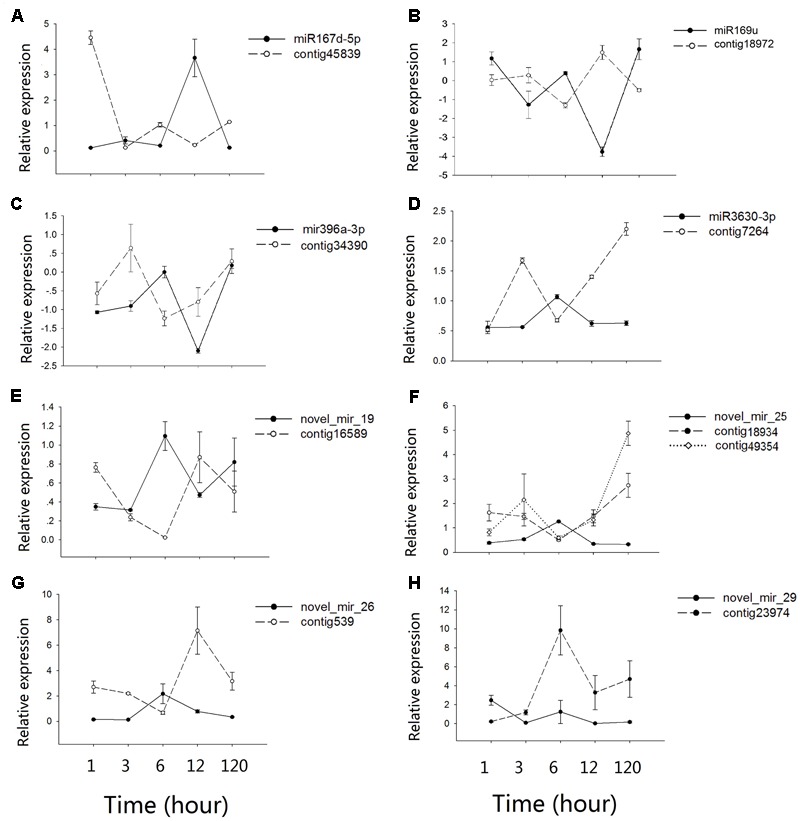
Co-expression patterns between microRNAs and their targets. (A–H) shows the qRT-PCR results for different microRNAs-mRNAs pairs. Values along the y-axis represent the differential expression log2 ratios between pond and upland samples. Relative expression quantification of microRNAs and their target genes was carried out using the 2-Δ ΔCt method, with UBC gene as internal control. Error bars represent mean ± SD (n = 3).