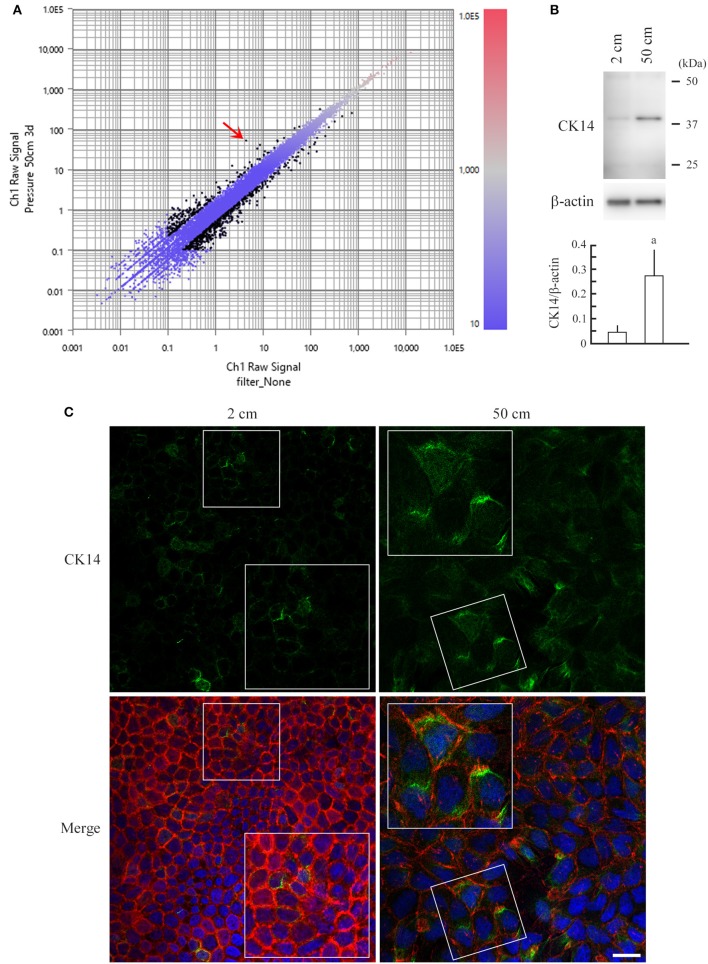
Figure 4.
RNA sequencing of MDCK cells and upregulation of keratin 14 in pressure-loaded MDCK cells. (A) Total RNA was extracted from MDCK cells that were cultured in 2- or 50-cm-high medium, and was subjected to RNA sequencing-based gene expression comparison analysis. The data are expressed as a scatter plot comparing the log10 fragments per kilobase of exon per million mapped fragments (FPKM) values for 2-cm-high-medium cultures (X-axis) vs. 50-cm-high-medium cultures (Y-axis). The FPKM values are displayed in a red-to-blue gradation, with blue and red indicating the lowest and highest values, respectively. Black dots indicate genes with >2-fold change. Keratin 14, the gene most upregulated in 50-cm-high-medium cultures, with an 11.869-fold change, is indicated with a red arrow. (B) MDCK cells were cultured in 2- or 50-cm-high medium, and were subjected to western blot analysis using an anti-keratin 14 antibody (upper panel). The blot was reprobed with an anti-β-actin antibody to indicate the amount of protein loading per lane. Intensities of the immunoreactive bands for keratin 14 and β-actin were measured densitometrically. The mean ratios of keratin 14 to β-actin and standard deviations were calculated from the data obtained in three independent experiments, and were statistically analyzed by Student's t-test. aP = 0.019 when compared with 2-cm-high-medium cultures. (C) MDCK cells were cultured on a semipermeable membrane in 2- or 50-cm-high medium for 3 days, then were triple-stained with keratin 14 immunofluorescence (green; upper), phalloidin labeling (red), and DAPI nuclear staining (blue). The three images are merged (lower). Boxed areas are enlarged to depict keratin 14 upregulation in the cytoplasm of pressure-loaded cells. Scale bar = 20 μm.

