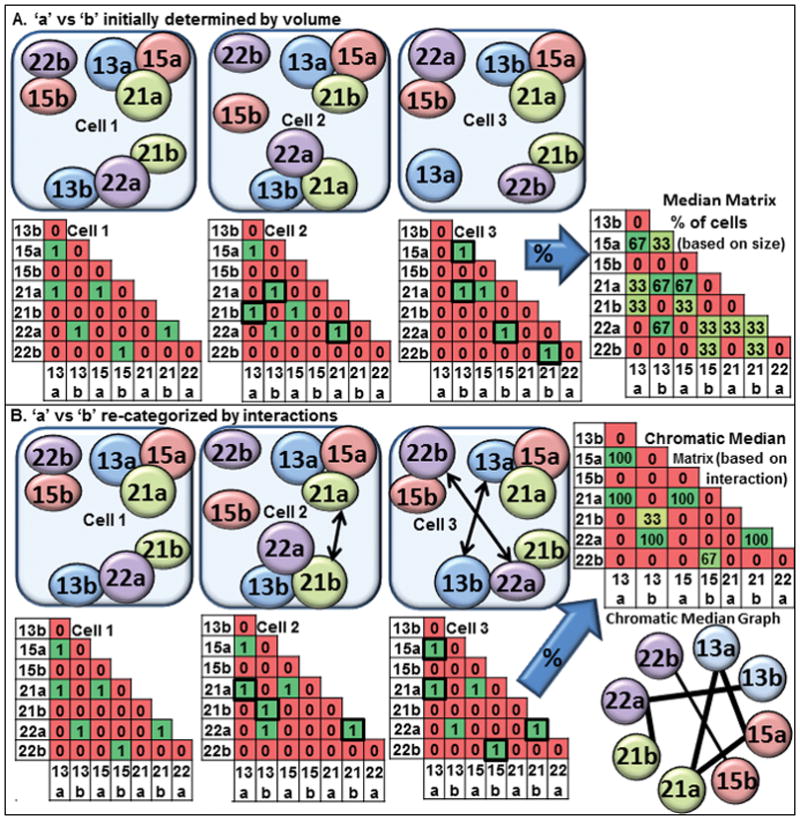
Figure 1. Diagram illustrating the chromatic median analysis.

(A) Three schematic drawings of CT associations in nuclei are shown with the larger homolog defined as copy ‘a’ and the smaller one as copy ‘b’. The associations are represented in binary matrices wherein a 1 indicates an interaction and a 0 the absence of an interaction; (B) The chromatic median program determines which homolog is “copy a” versus “copy b” based upon which other CT are associated and switches “a” for “b” to match the best fit model for the population. The percent of cells with an interaction at any given position within the matrix is calculated. Using a threshold, a chromatic median graph enriches for those connections which are greater than randomizations of the input matrices.
