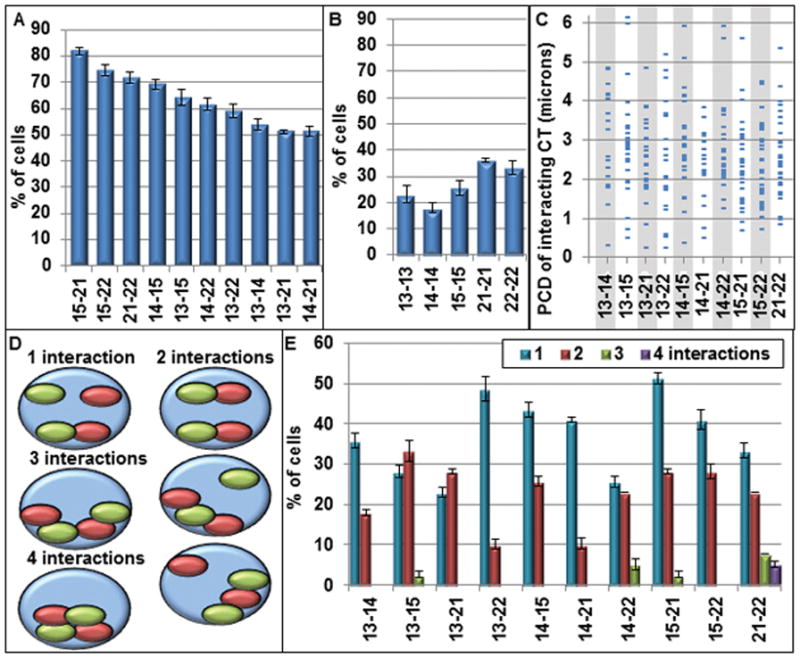
Figure 6. Pair-wise association profiles of NOR- CT.

The percent of cells with pairwise interactions between CT (nearest 3-D border distances ≤ 0.56 μm) are shown for heterologous (A) and homologous (B) CT pairs; (C) the corresponding pairwise center to center distances for the pairwise associations displayed in (A) range from 0.2 to >6 μm; (D) Since each CT has two homologs there are four possible interactions in each nucleus. The percent of cells that have 1, 2, 3 and 4 interactions are shown including 3 types with 2 interactions; (E) the percent of cells with single and multiple interactions are displayed for each heterologous pair of NOR-CT. Error bars = SEM
