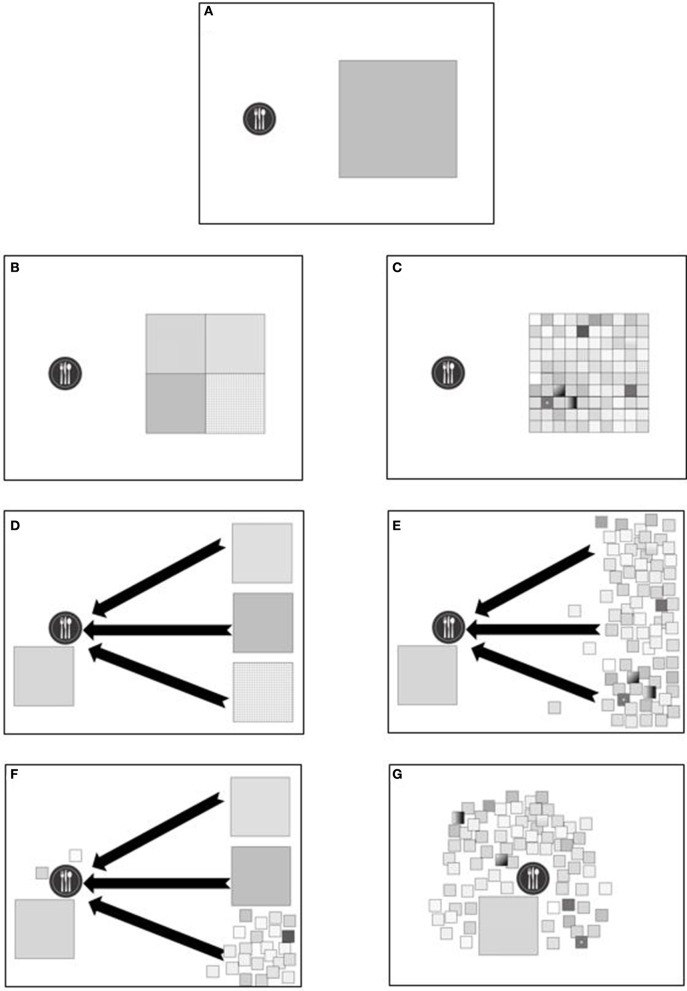
Figure 2.
Conceptual illustration of local food production, native plants and agro-diversity. Illustrations (A–G) describe the differences between native plant resources and local production, discussed further in the text. The plate represents a human community of consumers, and the squares represent their food resources. The area of each square represents its actual size and its relative contribution to the food supply of the consumers. A small square stands for a native plant that can supply food only when grown in its native range. The total area of squares is equal in all figures. (A) a community and its food demand; (B) a community reliant on four crops that each supply a quarter of the demand; (C) a community reliant on a high variety of plant resources, 25 times more diverse than community B; (D) a community fed by four plant resources, one of them is in proximity, the other three distant, demanding long chain of transports. Black arrows denote transport or food miles; (E) a community relying on one short-chain food resource and many small resources with long supply chains; (F) a mixture of one big resource in the vicinity of the community, two big and remote sources, and some small resources, most of them remote and two are local; (G) a community relying on a variety of locally grown plants.

