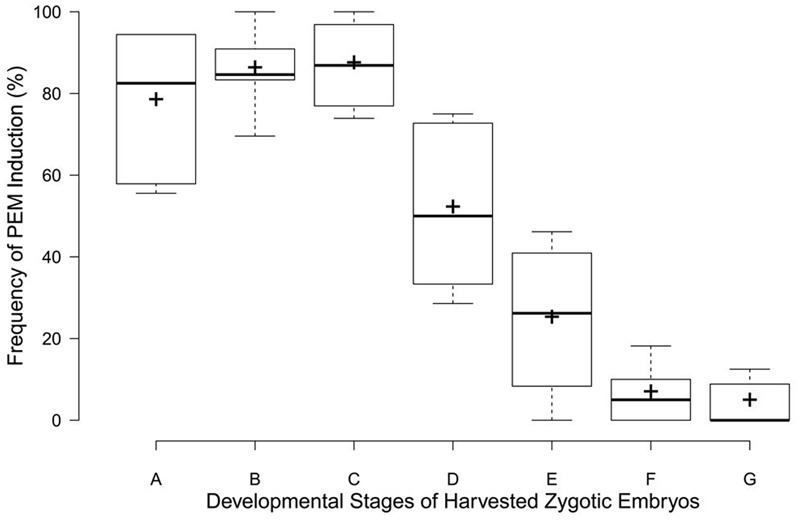
FIGURE 3.

Box plots for PEM induction frequencies at different developmental zygotic embryo stages in C. lanceolata. More than 30 seeds were analyzed for each embryonic stage. Stage A, cleaved polyembryogeny stages (Figure 1M); stage B, proembryo, only a dominant embryo (Figure 1M); stage C, further developed dominant embryo (Figure 1O); stage D, dominant embryo had formed apical meristem primordium (Figure 1P); stage E, more changes occurred in embryonal mass to cotyledon formation (Figure 1Q); stages F and G, maturation of cotyledonary embryo (Figures 1R,S). Minimum and maximum PEM induction frequencies are depicted by short black lines, the box signifies the upper and lower quartiles, and the median and mean are respectively represented by a thicker black line and a thicker plus sign within the box for each stage.
