
FIGURE 5.
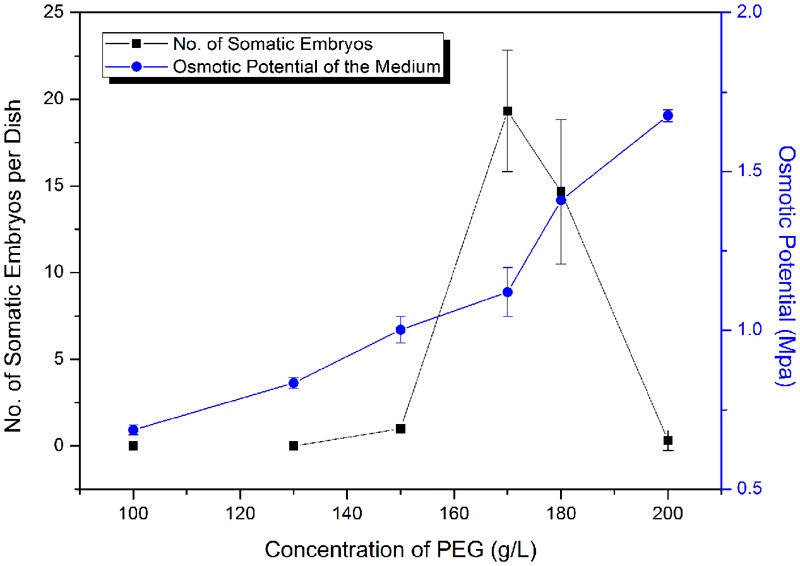
Frequency of somatic embryogenesis (SE) at different osmotic potentials. Data are means ± SD of three replicates.
Official websites use .gov
A
.gov website belongs to an official
government organization in the United States.
Secure .gov websites use HTTPS
A lock (
) or https:// means you've safely
connected to the .gov website. Share sensitive
information only on official, secure websites.
Frequency of somatic embryogenesis (SE) at different osmotic potentials. Data are means ± SD of three replicates.