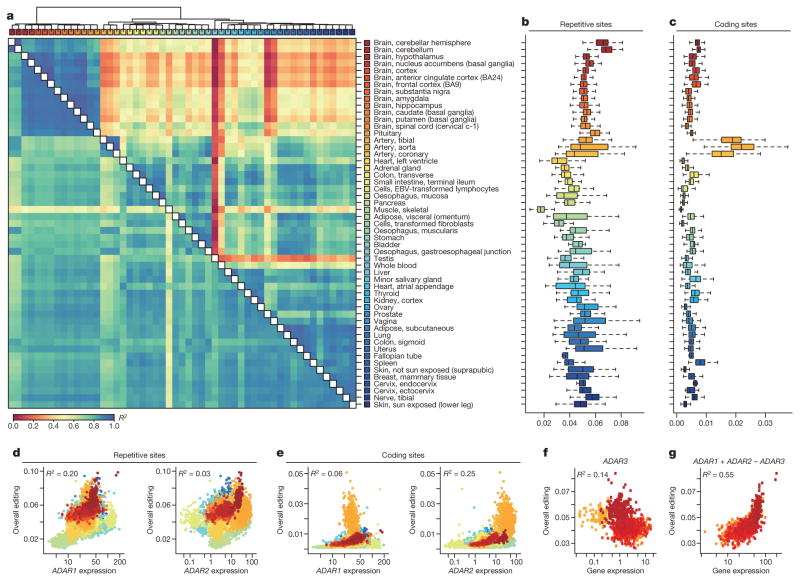
Figure 1. The GTEx multi-tissue RNA editome.
a, Heat map and dendrogram of Pearson correlations on the editing levels of 53 tissues calculated using all sites (below diagonal) or non-repetitive coding sites only (above diagonal). The dendrogram was drawn based on the distance metric computed by non-repetitive coding sites. The colour codes for GTEx tissues are the same as in a throughout, unless otherwise specified. b, c, Overall editing levels of repetitive (b) or non-repetitive (c) coding sites in various human tissues. Each box plot represents samples from one tissue type. Tissues are in the same order as in a (top to bottom). The overall editing level is defined as the percentage of edited nucleotides at all known editing sites. d, e, Correlations between expression levels of ADAR1 (quantified as the number of RNA-seq reads per kilobase of transcript per million mapped reads (RPKM)) and overall editing levels of either repetitive (d) or non-repetitive (e) coding sites in 8,551 GTEx samples. R2 values were calculated by robust linear regressions on overall editing levels and logarithmic transformed RPKM values. f, Correlation between the expression level of ADAR3 and overall editing level in various brain tissues. g, Correlation of ADAR1 and ADAR2 expression with overall editing of all sites in the brain tissues when the negative influence of ADAR3 was taken into account.

