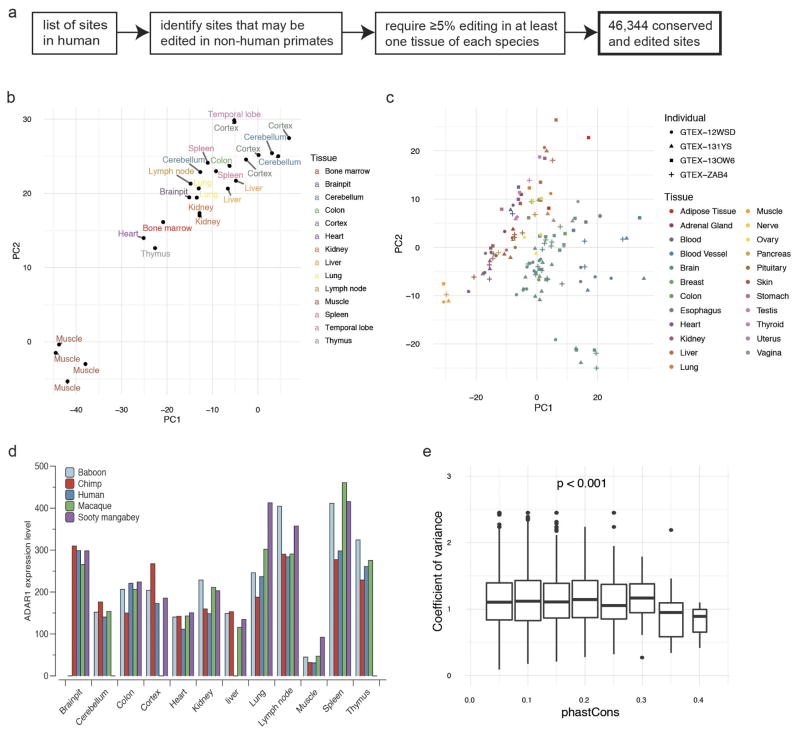
Extended Data Figure 6. Comparison of editing landscapes across different primates.
a, Workflow for the identification of 46,344 editing sites that are conserved between and edited in human and non-human primates. b, PCA of editing profiles in various tissues from different chimpanzee individuals. The samples are largely separated by tissue type. c, PCA of editing profiles in various tissues from four human subjects who participated in the GTEx project. We selected the top four individuals with RNA-seq data from the most number of tissue types. d, ADAR1 expression levels in various tissues of human and four non-human primates. e, Distribution of editing variance with sites binned according to the extent to which their surrounding sequences are conserved between different primates. Sites that are more highly conserved between species (high phastCons scores) showed lower variation in editing (low coefficient of variance). PhastCons scores were calculated using 500 bp flanking each editing site. Association test was performed using ANOVA.

