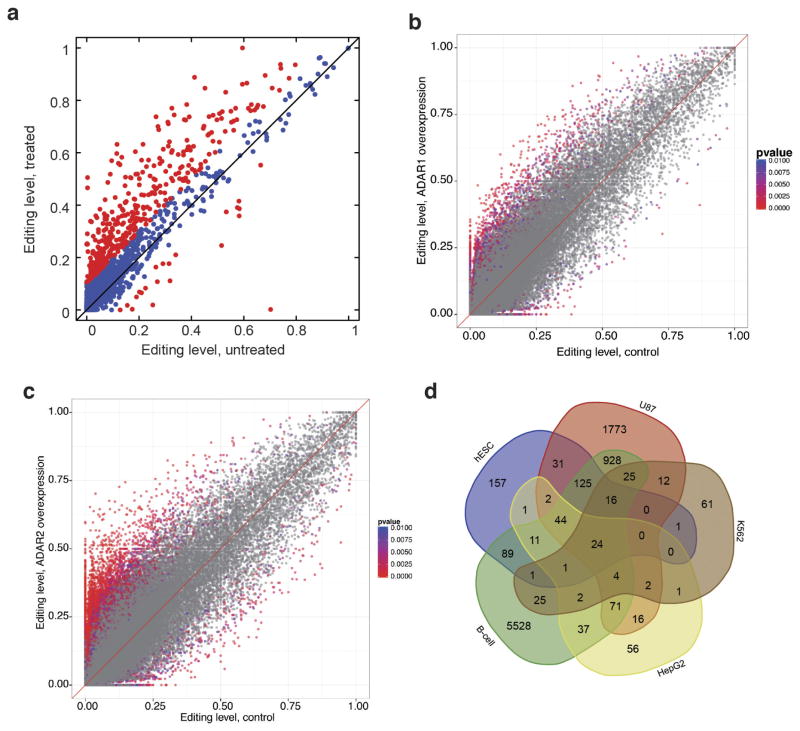
Extended Data Figure 7. Identification of ADAR1 and ADAR2 targets in human.
a, Editing levels for human 2fTGH cells that were either untreated or treated with IFNα. Sites that differ in editing by more than 10% between untreated and treated samples are marked in red. GO analysis of the differentially edited sites revealed a functional enrichment for genes involved in viral response or cytokine production, fatty acid metabolism, and intracellular transport. b, Comparison of editing levels between HEK293T cells with ADAR1 overexpression and control cells. P values were calculated using the Fisher’s exact test. c, Comparison of editing levels between HEK293T cells with ADAR2 overexpression and control cells. P values were calculated using the Fisher’s exact test. d, Venn diagram showing number of ADAR1 targets identified from different ADAR1 knockdown cell lines (see Supplementary Note 5 for details).

