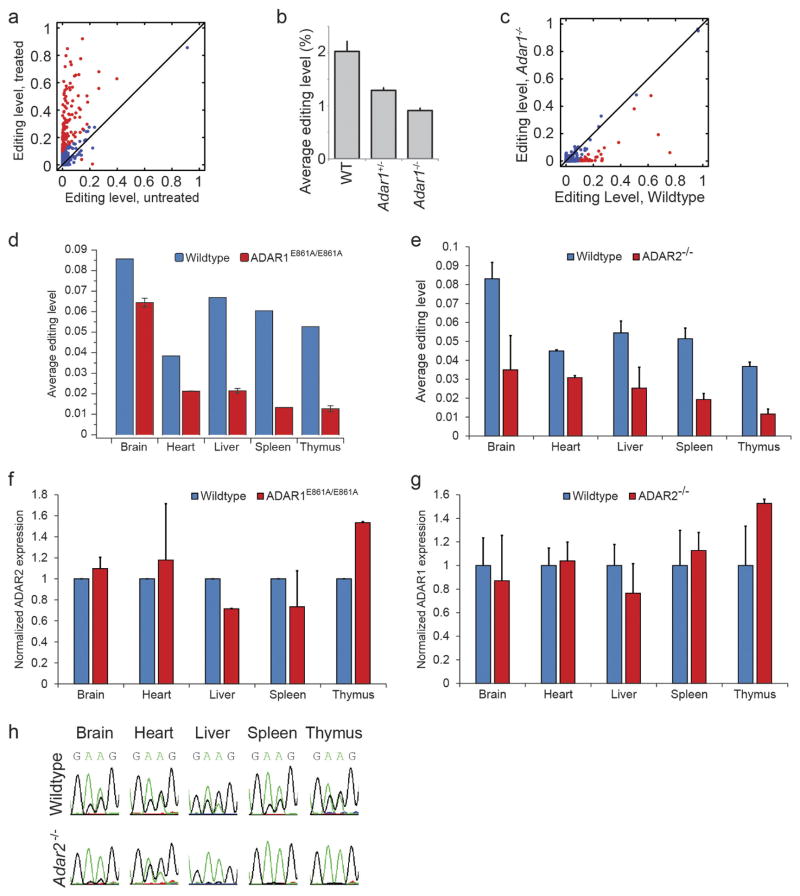
Extended Data Figure 8. Identification of ADAR1 and ADAR2 targets in mouse.
a, Editing levels for mouse embryonic fibroblasts that were either untreated or treated with IFNα. Sites that differ in editing by more than 10% between untreated and treated samples are marked in red. b, Average editing levels for wild-type, Adar1+/− and Adar1−/− E12.0 mouse embryos. Error bars represent s.d. of two (wild type), seven (Adar1+/−), or five (Adar1−/−) biological replicates. c, Comparison of editing levels between wild-type and Adar1−/− E12.0 mouse embryos. Sites that differ in editing by more than 10% between wild-type and knockout mice are marked in red. d, Average editing levels of sites in different tissues from wild-type and Adar1E861A/E861A mice. Error bars represent s.d. of two biological replicates. e, Average editing levels of sites in different tissues from wild-type and Adar2−/− mice. Error bars represent s.d. of two (heart), four (spleen and thymus), or six (brain and liver) biological replicates. f, Normalized expression levels of Adar2 in various tissues from wild-type and Adar1E861A/E861A mice. Error bars represent s.d. of two biological replicates. g, Normalized expression levels of Adar1 in various tissues from wild-type and Adar2−/− mice. Error bars represent s.d. of two (heart), four (spleen and thymus), or six (brain and liver) biological replicates. h, Chromatograms from Sanger sequencing of two clustered sites on chromosome X at positions 160415964 and 160415965 in the Car5b gene (reverse strand) are shown as examples for different modes of regulation across tissues.

