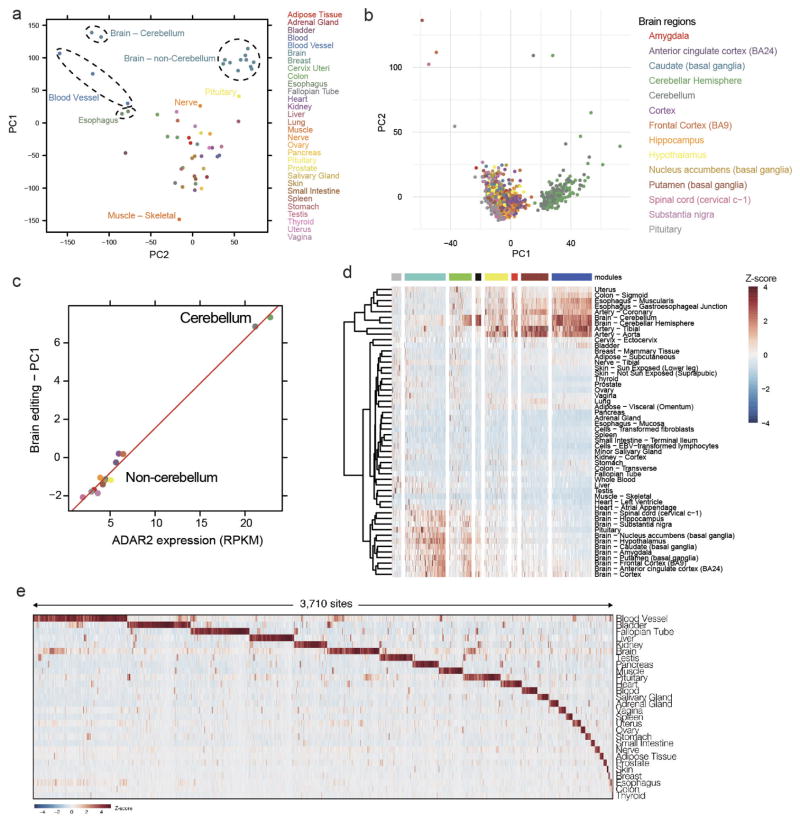
Extended Data Figure 1. Analysis of GTEx RNA-seq data.
a, PCA was applied to the editing levels of all sites in every GTEx body part. The brain tissues were separated from other non-brain tissues. b, A focused PCA of editing in individual brain tissues highlighted that the cerebellum was distinct from other brain regions. c, Correlation between the first editing principal component (PC1) and the expression level of ADAR2 in various brain tissues. d, Co-editing network analysis of 2,094 sites that exhibited high variation across tissues (coefficient of variance >0.8) detected 8 regulatory modules (coloured in grey, turquoise, green, black, yellow, red, brown and blue). e, Heat map of editing levels from sites that are specifically edited in a single human tissue. The editing levels are normalized across samples for each site.

