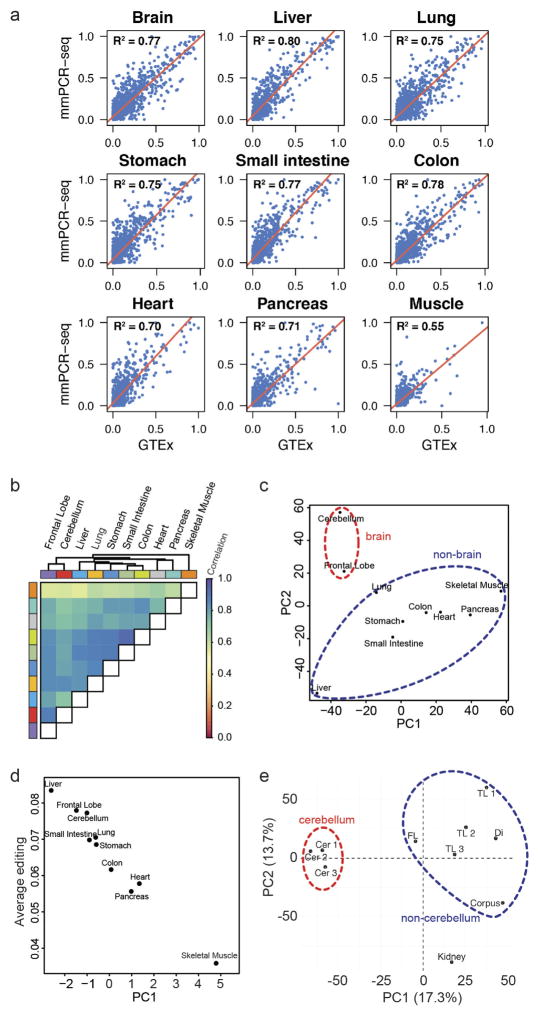
Extended Data Figure 2. Analysis of adult human tissues by mmPCR–seq.
a, Comparisons between mmPCR–seq editing level measurements and RNA-seq data from the GTEx project for different human tissues. R2 values were calculated by simple linear regression. b, Pearson correlations between the editing profiles of different adult human tissues from a single individual (N37), as measured by mmPCR–seq. c, PCA of editing levels in different tissues from N37 revealed that the brain samples were separated from non-brain samples. d, Scatterplot between the loading of PC1 and the average editing level for each N37 tissue. PC1, which explained over 30% of the editing differences between tissues, corresponded to average editing levels of the tissues. Editing activity was lowest in the skeletal muscle of N37, similar to what was observed in the GTEx data. e, PCA of editing in various brain tissues from a single individual (N6) revealed that the cerebellum was distinct from other brain anatomical regions. Cer, cerebellum; Corpus, corpus callosum; Di, diencephalon; FL, frontal lobe; TL, temporal lobe.

