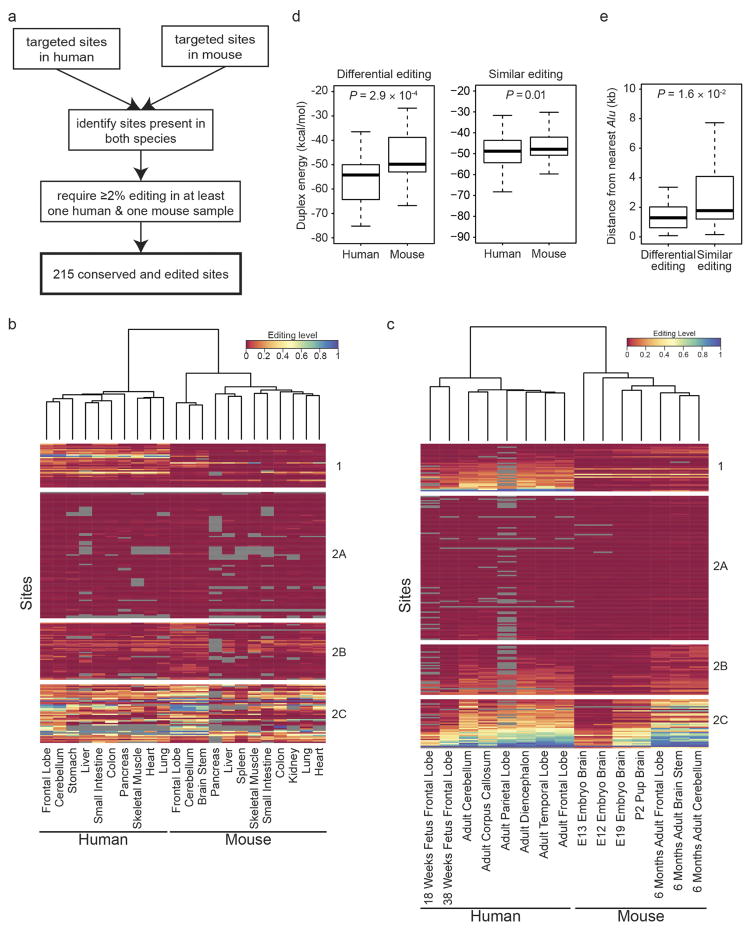
Extended Data Figure 5. Comparison of human and mouse editing landscapes.
a, Workflow for the identification of 215 editing sites that are targeted in mmPCR–seq and conserved between and edited in human and mouse. b, Heat map showing editing levels of the 215 conserved sites for various human and mouse adult tissues. The tissues (columns) were clustered hierarchically based on correlations of editing levels between them. The dendrogram on top represents the distances between tissue samples. Sites (rows) were clustered into positions that either differed significantly in editing between human and mouse (group 1) (P <0.01, Wilcoxon rank sum test) or were similarly edited between the two species (groups 2A, 2B and 2C). Group 2A: highest editing level <0.04 in both human and mouse; group 2B: 0.04 ≤highest editing level <0.2; group 2C: highest editing level ≥0.2. c, Heat map showing editing levels of the 215 conserved sites for various human and mouse developmental stages. Clustering was performed in a similar manner to that in b, and the same groupings were used. d, RNA duplex free energies for human and mouse sites with differential (group 1) or similar (groups 2A, 2B and 2C) levels of editing. The secondary structures in human displayed significantly lower free energy than those in mouse (P <0.001, Wilcoxon rank sum test) for group 1 sites, which were generally edited at higher levels in human and primarily responsible for the separation of human and mouse in the clustering. e, Distance from nearest Alu element for differentially edited sites (group 1) and similarly edited sites (groups 2A, 2B and 2C). In human, group 1 sites were significantly closer to Alu repeats than group 2 sites (P <0.05, Wilcoxon rank sum test).

