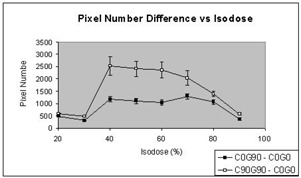
Figure 4.

The mean differences in pixel number between setting 3 (gantry 90°, collimator rotation 90°) and setting 1 (gantry 0°, collimator rotation 0°), and between setting 2 (gantry 90°, collimator rotation 0°) and setting 1 of 13 fields, were plotted as a function of isodoses in the range 20% to 90%.
