Figure 2.

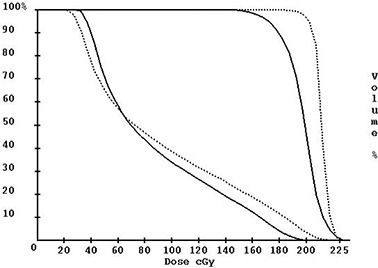
Dose‐volume histogram of the planning tumor volume (curves on the right) and the adjacent left eye (curves on the left). The dotted lines are from the planning system, and the solid lines are from the 3D dose reconstruction method. (1)

Dose‐volume histogram of the planning tumor volume (curves on the right) and the adjacent left eye (curves on the left). The dotted lines are from the planning system, and the solid lines are from the 3D dose reconstruction method. (1)