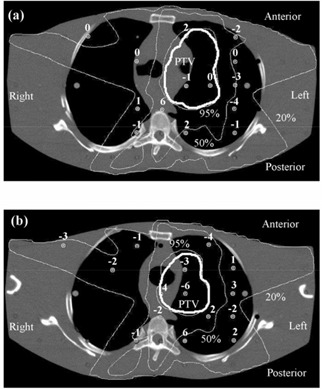
Figure 8.

Verification of a lung IMRT plan using TLD, showing transaxial planes (a) 1 cm inferior and (b) 1.5 cm superior to the isocentric plane. The dose differences represent the planned dose in relation to the delivered dose, expressed as a percentage of the isocentric dose. Isodoses are normalized to the isocenter.
