Figure 5.

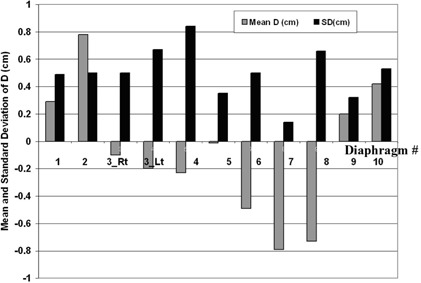
The mean and standard deviation of D ( and ) for the liver cancer patients. Note that there are two sets of bars for patient 3, for whom both right and left diaphragms were monitored.

The mean and standard deviation of D ( and ) for the liver cancer patients. Note that there are two sets of bars for patient 3, for whom both right and left diaphragms were monitored.