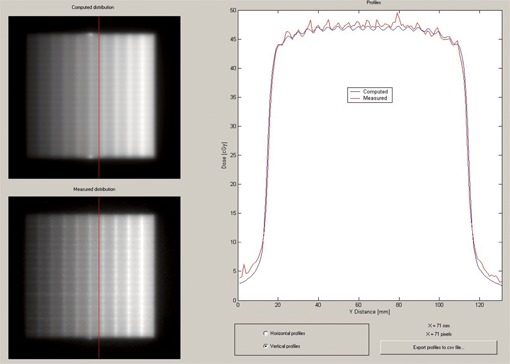
Figure 8.

DoseLab profile comparison window showing profiles in the y‐direction for the strip test pattern. The Pinnacle‐computed distribution is shown in the upper‐left corner, and the measured distribution is shown in the lower‐left corner of the image. The red line indicates the location of the profile.
