
Figure 12.
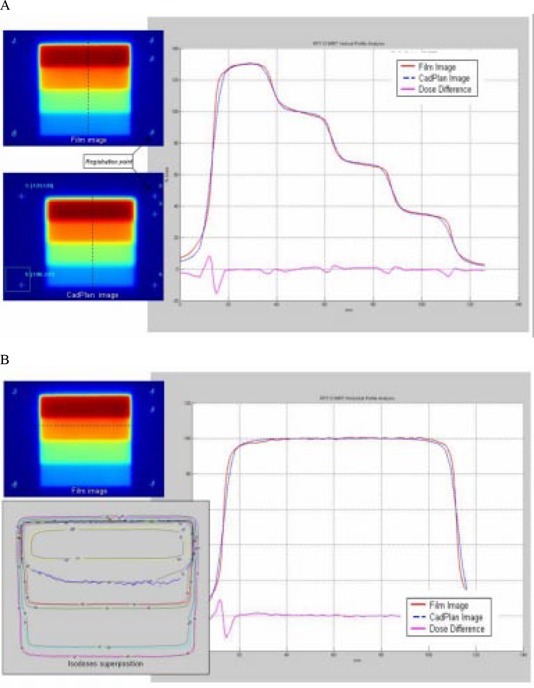
(a) Comparison between TPS calculated and measured relative dose for the wedge test field in the direction of leaf movement. Profile superposition shows an agreement better than 2% in the HD‐LG region. Dose difference increases at the edge of each dose level. (b) Comparison in a direction perpendicular to leaf movement shows dose difference similar to the uniform test field. Isodose superposition shows agreement better than 4% dose difference and 3‐mm distance to agreement.