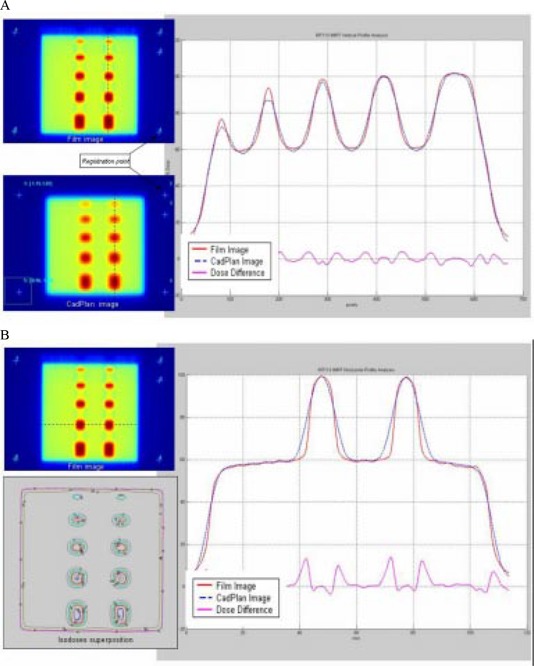
Figure 13.

(a) Comparison between TPS calculated and measured relative dose for the peak test field in the direction of leaf movement. Profile superposition shows an agreement better than 2% for 15‐mm and 10‐mm peak width, 3% for 7.5‐mm peak width, 5% for 5‐mm peak width, and 7% for 2.5‐mm peak width. (b) Comparison in a direction perpendicular to leaf movement; profile superposition shows an agreement better than 2%. Dose difference increase in the high gradient region.
