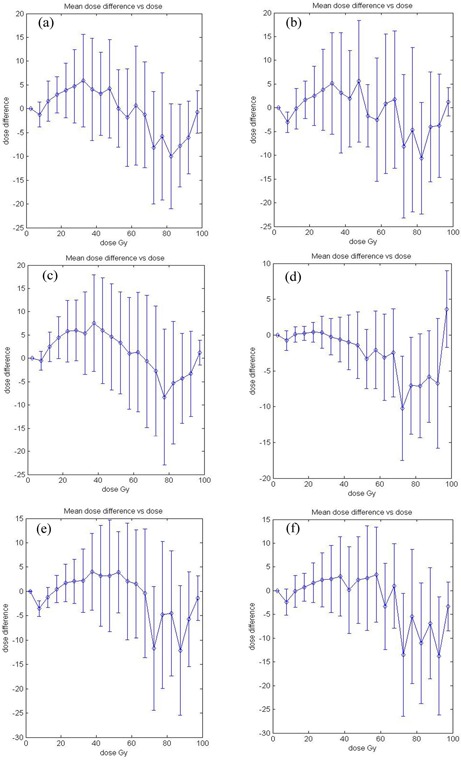
Figure 3.

Dose‐dependent dose‐difference diagram (D4 diagram). The diamond symbols indicate the mean dose difference. The error bars are for one standard deviation. Dose difference is calculated by subtracting measured dose from LGP‐calculated dose. The maximum dose is normalized to 100 Gy or 100% for both measured and calculated dose distributions. (a) Experiment 1: 8 mm collimator; (b) experiment 2: 8 mm collimator; (c) experiment 3: 8 mm collimator; (d) experiment 4: 14 mm collimator; (e) experiment 5: 14 mm collimator; (f) experiment 6: 18 mm collimator.
