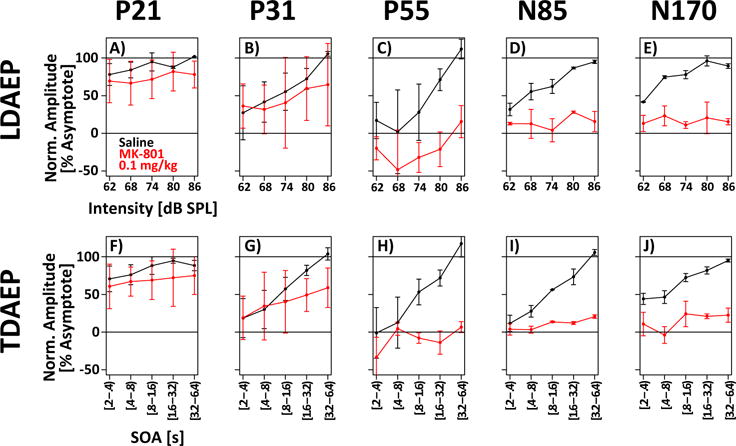
Figure 3. MK-801 blunts time- and intensity-dependence of the N85.

Normalized component amplitude is plotted as a function of intensity (top row) or SOA (bottom row) for five different AEPs (columns). On vehicle days (black), many components scale with intensity and SOA. On MK-801 days, this scaling is blunted. The blunting is most evident for the N85 and N170 components. Statistics for individual subjects and AEP components are presented in Table 1.
