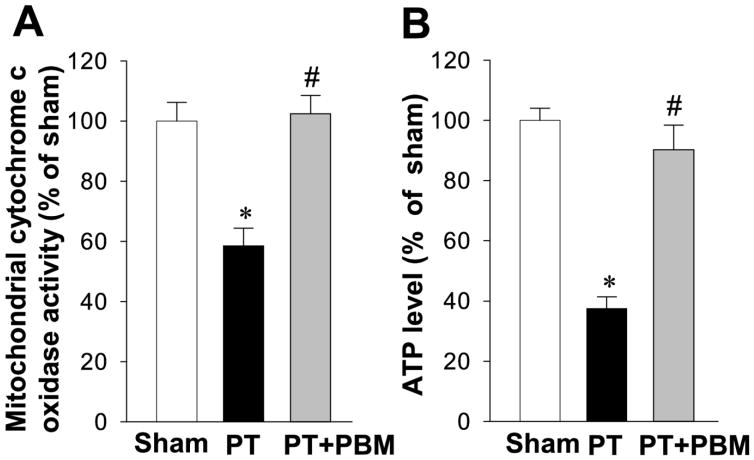
Fig. 6. Effect of PBM on the activity of mitochondrial cytochrome c oxidase and the production of ATP in the cortical peri-infarct region.
Mitochondrial cytochrome c oxidase activity (A) and ATP production (B) in total protein samples were measured. The results of PT stroke group and PBM group are quantified as percentage changes versus sham. Values are expressed as mean±SE (n=5). *P<0.05 versus sham, #P<0.05 versus PT group.

