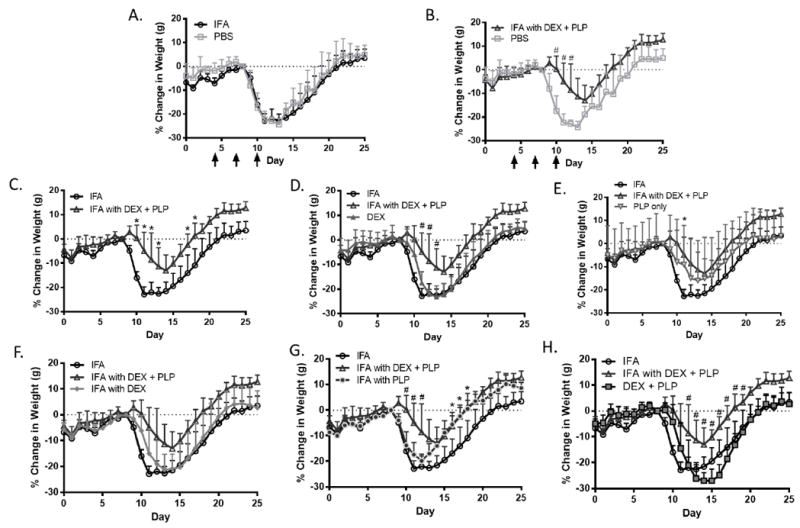
Figure 4.

Percent change in weight as compared to day 8 (last day before symptoms) in EAE mice given components of co-delivery treatment, IFA with DEX + PLP. Percent weight change with PBS control treatment compared to A.) IFA and B.) IFA with DEX + PLP. IFA and IFA with DEX + PLP treatments were compared to C.) each other, D.) DEX treatment, E.) PLP treatment, F.) IFA with DEX, G.) IFA with PLP and H.) DEX + PLP. All treatments were given on days 4, 7, and 10 (black arrows). (n = 5-6 mice per group, * p< 0.05 as compared to IFA, # p<0.05 as compared to IFA with DEX + PLP)
