
Figure 3. Doxorubicin accumulation, penetration and dosage to MCF-7 and MDA-MB-231 in T-MOC.
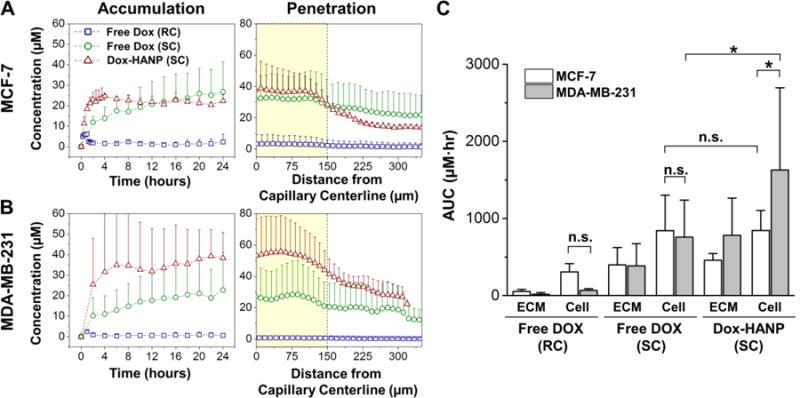
Spatiotemporal ECM accumulation and penetration profiles of free Dox and Dox-HANP on the T-MOC for (A) MCF-7 and (B) MDA-MB-231. (C) Area under the curve (AUC) based on cell and ECM accumulation profiles, representing cumulative drug exposure of the two cell lines during different treatments. RC: Rapid Clearance, SC: Slow Clearance, * p-value < 0.05. n.s: not significant.