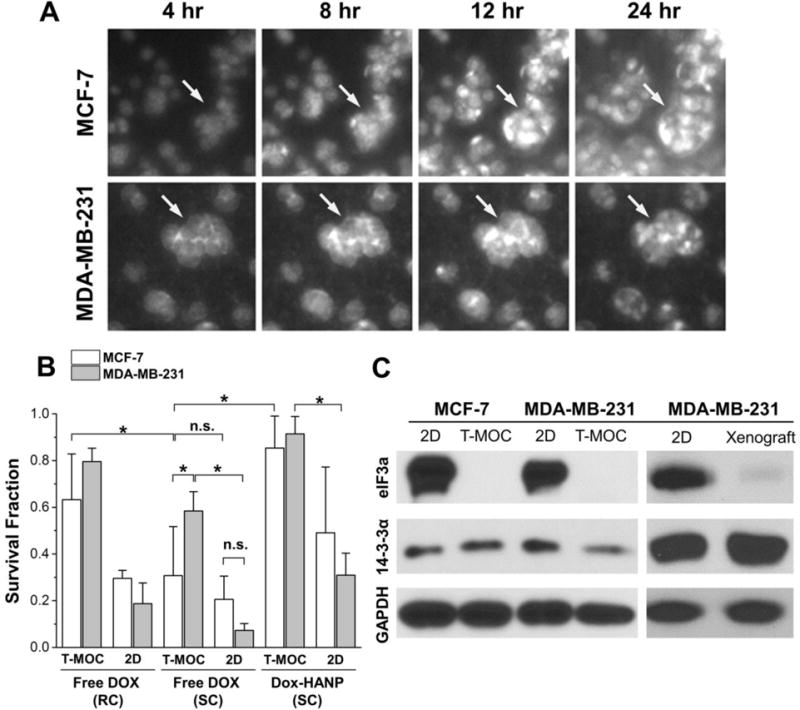
Figure 4. Post-treatment analysis of drug response of breast cancer cells on T-MOC platform.

(A) Time-lapse fluorescence micrographs of cellular drug uptake and cell-type specific response. (B) Post-treatment survival fraction of breast cancer cells cultured on T-MOC and 2D conditions. Results reported in terms of mean ± standard error. Both cell lines became significantly more resistant to Dox on T-MOC, compared to 2D culture (p-value < 0.05). While the two cell lines showed similar levels of resistance to Dox in 2D culture, MDA-MB-231 became significantly more resistant than MCF-7 on T-MOC (p-value < 0.05). (C) Western-blot of doxorubicin resistance-associated proteins of breast cancer cells cultured on T-MOC and 2D conditions as well as in vivo tumor xenograft model.
