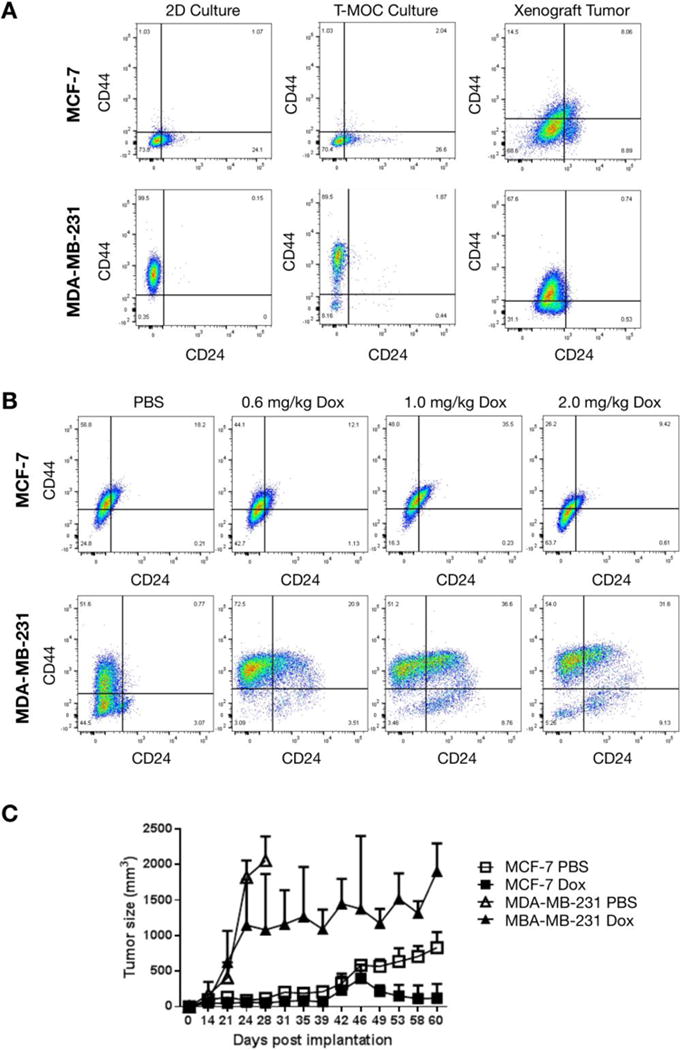
Figure 5. Comparison of cell phenotypes cultured in T-MOC and xenograft.

(A) Flow cytometry of CD44 and CD24 expression of cells cultured in different conditions. (B) Cellular phenotype change of xenografted MCF-7 and MDA-MB-231 cells after doxorubicin treatments. (C) Tumor progression during 2.0mg/kg doxorubicin treatments.
