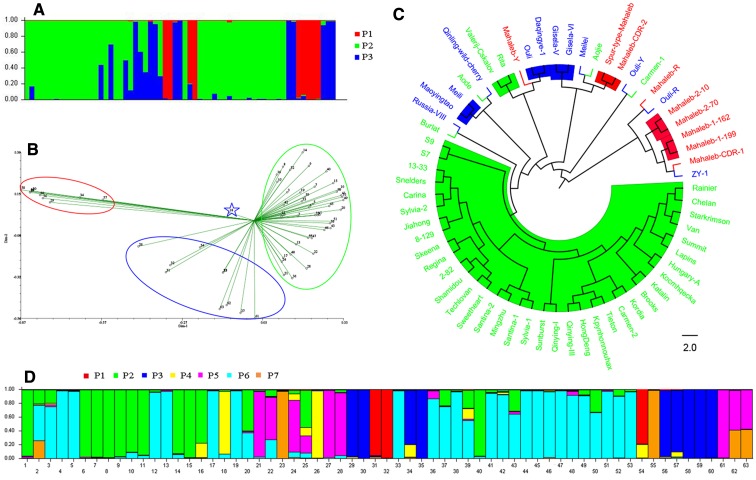
Fig. 3.
Characterization of genetic structure in the 63 cherry accessions. a, d population structure. Colored bars represent accessions grouped into the corresponding inferred population. b Principal component analysis (PCA) plot of 63 accessions encircled by different colors corresponding to the model-based structure. c Phylogenic tree of 63 accessions based on unweighted pair-group method with arithmetic average (UPGMA). Colored clades correspond to inferred populations

