Figure 2.

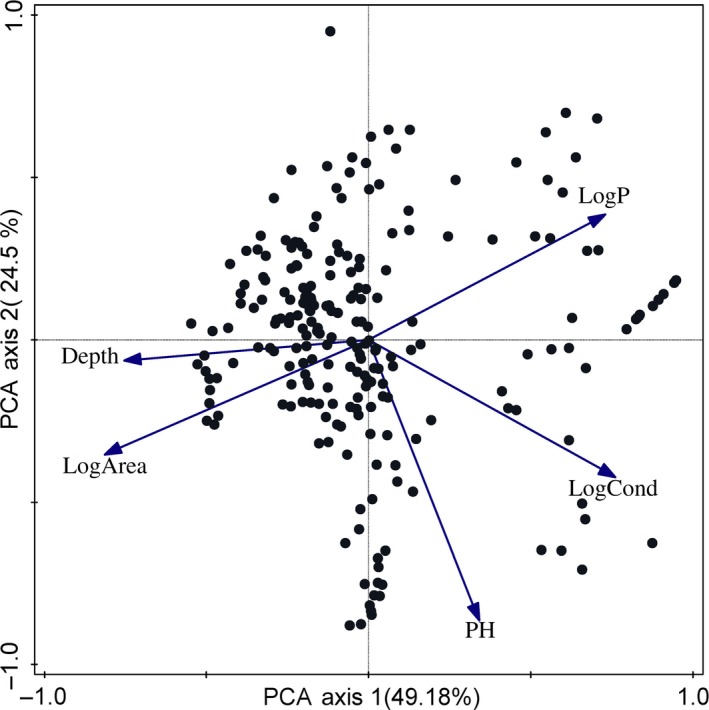
PCA diagram for the environmental variables based on sample‐level data. Explained cumulative variation in the first two axes: 73.23%

PCA diagram for the environmental variables based on sample‐level data. Explained cumulative variation in the first two axes: 73.23%