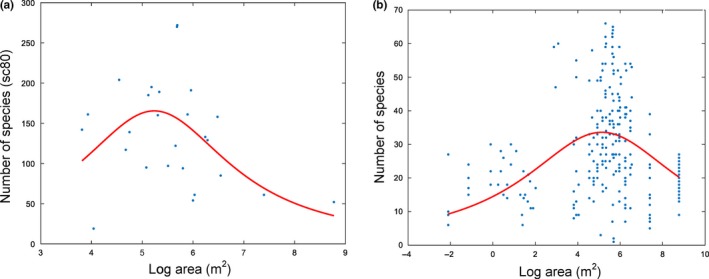
Figure 3.

Relationship between (a) estimated and (b) observed sample‐level species richness and water body size for planktonic algae. The regression curves to the data were added using the polynomial Lorentzian peak fit. (a) a1_fit = 556.882, a2_fit = 5.23563, a3_fit = 3.36695; (b) a1_fit = 861.074, a2_fit = 5.77057, a3_fit = 27.4237
