
Figure 3.
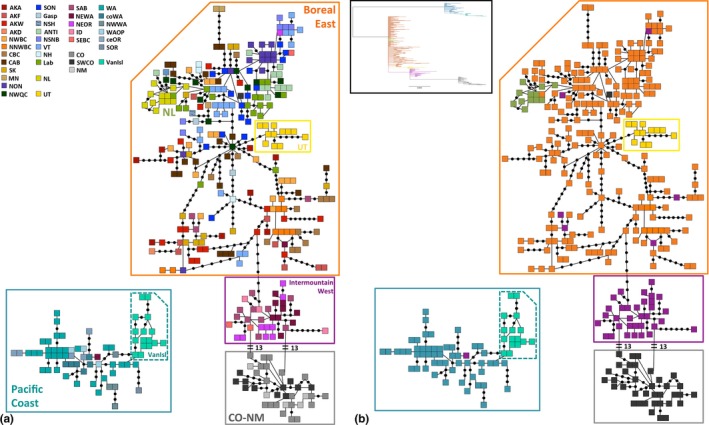
Statistical parsimony network of mtDNA haplotypes. Statistical parsimony network of 261 gray jay mitochondrial DNA haplotypes for 375 individuals reflecting main haplogroups. Each square represents one individual, individuals with the same haplotype are adjacent, and black dots represent an inferred haplotype. In (a) colors correspond to sampled populations (see legend in top left) and (b) colors correspond to general haplogroups or population source. Population abbreviations and locations are given in Table 1. Box: Simplified phylogenetic tree with colors corresponding to sampled populations as in b)